Memo to traders back from the most bruising bout of the bull market. If the past is any precedent, the rewards of sticking around can be high.
A century of data shows that a decent time to own stocks is just after they bounce back from a fallow period like the one that ended Tuesday. On average, when the S&P 500 goes seven months without a record, it generated returns of 14% over the next year after recovering.
Advertisement
Maybe it’s psychology. What doesn’t kill you makes you stronger. A villain that scared everyone half to death exits the stage. Whatever the reason, it’s a plank in the melt-up thesis that points to years like 2012 and 1999, when robust health followed a near-death experience.
“This can be a virtuous circle on the way up: Higher stock prices boost confidence, which in turn pushes stock prices even higher,” said Brad McMillan, chief investment officer for Commonwealth Financial Network. “You will see new highs on a regular basis once it catches up to the previous high.”
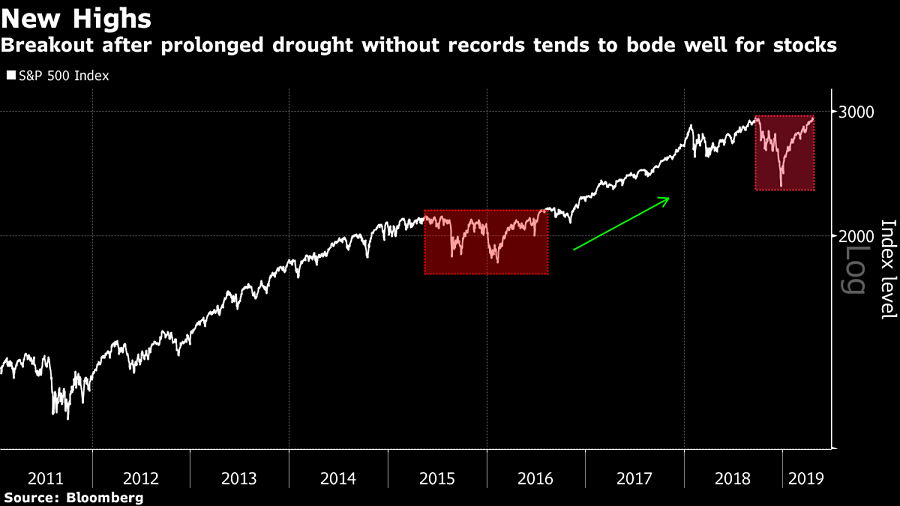
On Tuesday, the S&P 500 scored its first record high since September, making the 2018 carnage a memory. While pundits ponder whether this is the 10-year rally’s last hurrah, keep in mind that never before has a bull market died on a breakout from a dry spell that has persisted as long as this.
In fact, the market has tended to keep rising after an end to a prolonged drought. Since 1927, the S&P 500 has witnessed rebounds from lulls that lasted longer than the current one — often a lot longer — 17 times. All but one were followed by higher prices. The average gain in the 12 months after was 14%.
Sure, there is no guarantee stocks will follow the historic playbook. Everything from monetary policy uncertainty to a potential profit recession is giving investors pause. Three weeks into the reporting season, the earnings picture is mixed. While 79% of companies have beaten estimates on earnings, only 45% did that on sales.
“Some of the things that scared the market in the fourth quarter have really been eliminated, such as an overly hawkish Fed, the government shutdown, trade tensions,” said Jim Tierney, AllianceBernstein’s chief investment officer for U.S. concentrated growth. “So to me it makes sense where we’re at, but I think from here it gets a little bit tougher because now it gets down to earnings growth.”
(More: Stock investors shrug off yield curve worries)
Giant yawns
The breakout has been greeted with giant yawns by investors. Hedge funds just started tiptoeing back into the market. After trimming their equity exposure to the lowest level in at least a year in early April, hedge fund clients have started raising their bets, data compiled by JPMorgan’s prime brokerage unit showed. Still, with bullish bets outpacing bearish ones by 1.6-to-1 last week, the ratio sat at the 22nd percentile over the past year.
Similarly, inflows to exchange-traded funds have paled in comparison to those leading up to the peaks of last year. Investors added $15 billion to U.S. equities during the month through Tuesday. That compares with one-month inflows of $82 billion and $50 billion before records were hit in January and September of 2018, respectively.
To contrarians, who see danger in numbers and dread euphoria, all that is good news because it means there are still buyers left to push prices higher. Sometimes too quickly, according to Matt Miskin, a market strategist at John Hancock.
“We’re starting to see, anecdotally, the FOMO undertow for investors starting to pull them in,” he said. “If you just see that tide turn and you see the end investor start to chase here, that could lead to suboptimal outcomes.”
Recent history
Is it unusual for stocks to stage a brisk rebound following a deep rout? Not really, at least going by recent history. Only twice over the past two decades has the S&P 500 endured a peak-to-trough decline of close to 20%, in 1998 and 2011. Both times the market erased losses within five months.
What happened next? Outsize returns. In November 1998, when the losses incurred during the Asian currency crisis were restored, the S&P 500 went on to advance 18% over the next year, double the historic pace of gains.
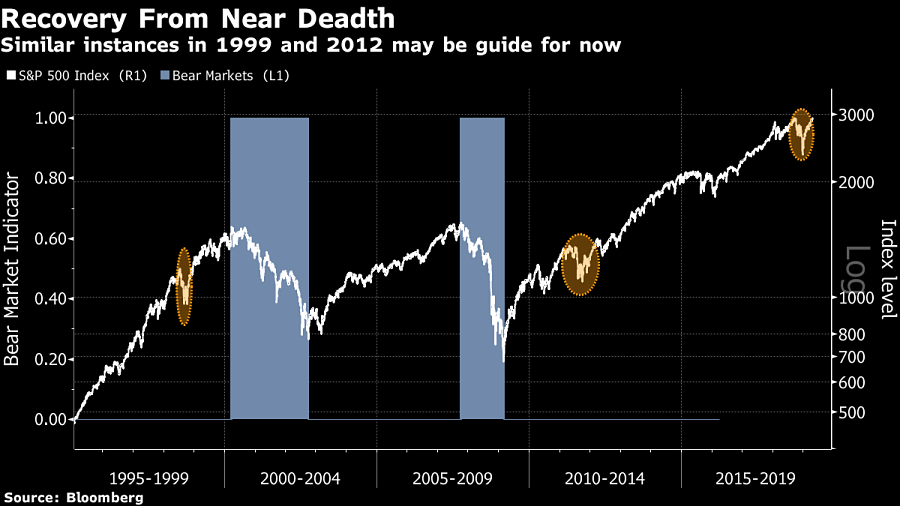
In the other case where stocks healed sovereign-debt induced pain, in February 2012, the benchmark gauge also delivered above-average performance, rising 11% in the ensuing 12 months.
“I want my money in equities. We’re optimistic,” said Gary Bradshaw, a portfolio manager at Hodges Capital Management. “It’s like pulling teeth trying to get investors to buy these stocks, and I just think they can keep going.”